Figure 2.
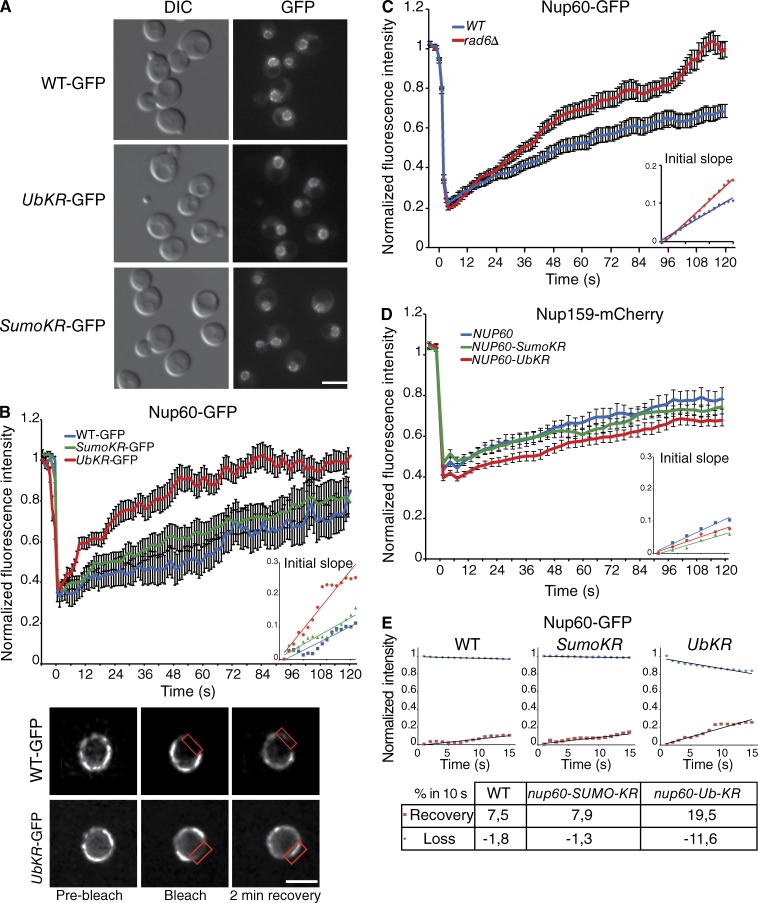
Nup60 ubiquitylation controls the association dynamics of Nup60 with the NPC. (A) Steady-state localization of GFP-tagged Nup60 in WT, nup60-UbKR, and nup60-SUMO-KR strains. Bar, 5 µm. (B) Mean fluorescence recovery curves after photobleaching for WT (blue, n = 28), nup60-Ub-KR cells (red, n = 31), and nup60-SUMO-KR (green, n = 29). The bottom panel presents a typical example of images acquired during FRAP experiments in cells expressing either Nup60-GFP or nup60-UbKR-GFP. The red rectangle highlights the bleached zone after a 50-ms bleach pulse. Bar, 1.5 µm. (C) Mean fluorescence recovery curves for Nup60-GFP in WT (blue; n = 35) and rad6Δ (red; n = 27) cells. (D) Mean fluorescence recovery curves for Nup159mCh in NUP60 (blue; n = 27), nup60-Ub-KR (red; n = 51), and nup60-SUMO-KR (green; n = 34) cells. (E) Dynamics of fluorescence recovery (red square) compared to the dynamics of the loss of fluorescence in the nonbleached area (blue dot) in WT, nup60-SUMO-KR, and nup60-Ub-KR. The initial slopes presented in the table have been calculated with a linear fit (black line). The error bars in B–D correspond to SEM.

