Figure 1.
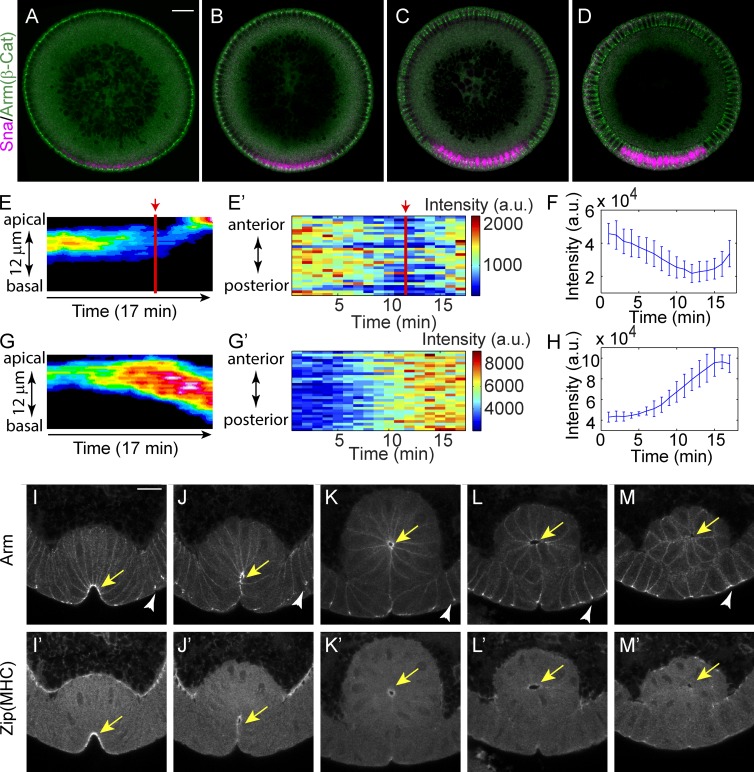
Early expression of Snail cannot disassemble adherens junctions until the disappearance of apical actomyosin. (A–D) Expression of Snail protein during early and mid-cellularization. Bar, 20 µm. β-Cat, β-catenin. (E and F) Junction intensity in the ventral cells shows a transient decline until the junctions begin to shift apically. Red lines and arrows indicate the initiation of junction shift. (E) Kymograph of the lateral max projection showing intensity changes. Signals from basal junctions are removed for clarity. (E′) Heat map showing temporal changes in junction intensity. Each stripe at one time point shows the junction intensity along the anterior–posterior axis of a tracked region of interest containing 5(D–V) × 10(A–P) cells around the midline of the mesoderm. (F) Change in total intensity of junctions in the region of interest as in E. Mean and SD from three embryos is shown. (G and H) Changes in junction intensity in dorsal cells during comparable stage. Embryos are aligned in time by the progression of cellularization. (H) Mean and SD from three embryos is shown. a.u., arbitrary units. (I–M) Myosin (myosin II heavy chain [MHC], zipper [zip]) and junctions (Armadillo/β-catenin) coexist after ventral cell invagination and simultaneously disappear before cells lose their epithelial morphology. Yellow arrows indicate the accumulation of adherens junctions and apical myosin in ventral mesodermal cells. White arrowheads indicate adherens junctions in flanking ectodermal cells. Bar, 15 µm.

