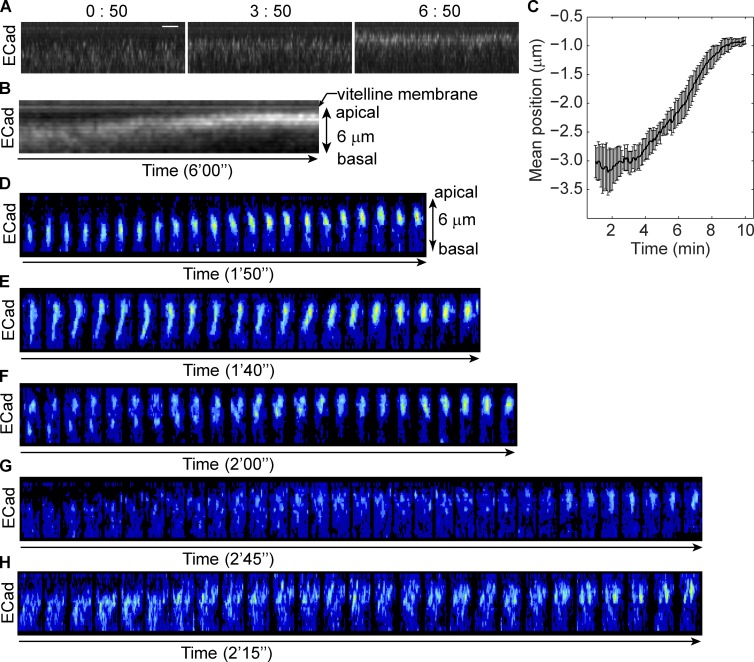
Figure 2.
Adherens junctions move directly from subapical position to apical position. (See also Fig. S1 and Videos 1–3.) (A) Projections of resliced stacks show the position and intensity change of E-Cad::GFP in a living embryo. Bar, 2 µm. (B) Kymograph of E-Cad::GFP shows continued movement of junctions. (C) The change of mean position of junctions during apical constriction as indicated by the distance below the vitelline membrane (position of vitelline membrane is defined as 0 µm). n = 5. (D–H) Junction clusters on single vertex or edge visualized by E-Cad::GFP. Each tile is a 3D reconstructed image, and tiles are 5 s apart in time. Only the time periods exclusively showing a single mode of movement are shown. (D) A single junction cluster moves from subapical to apical position. (E) A junction cluster shrinks along the apical-basal axis. (F) Two junction clusters on a single vertex move apically while the more basal one catches up and fuses with the more apical one. (G) Junction clusters form de novo around apical position. (H) Clusters on a single edge move apically as a group.

