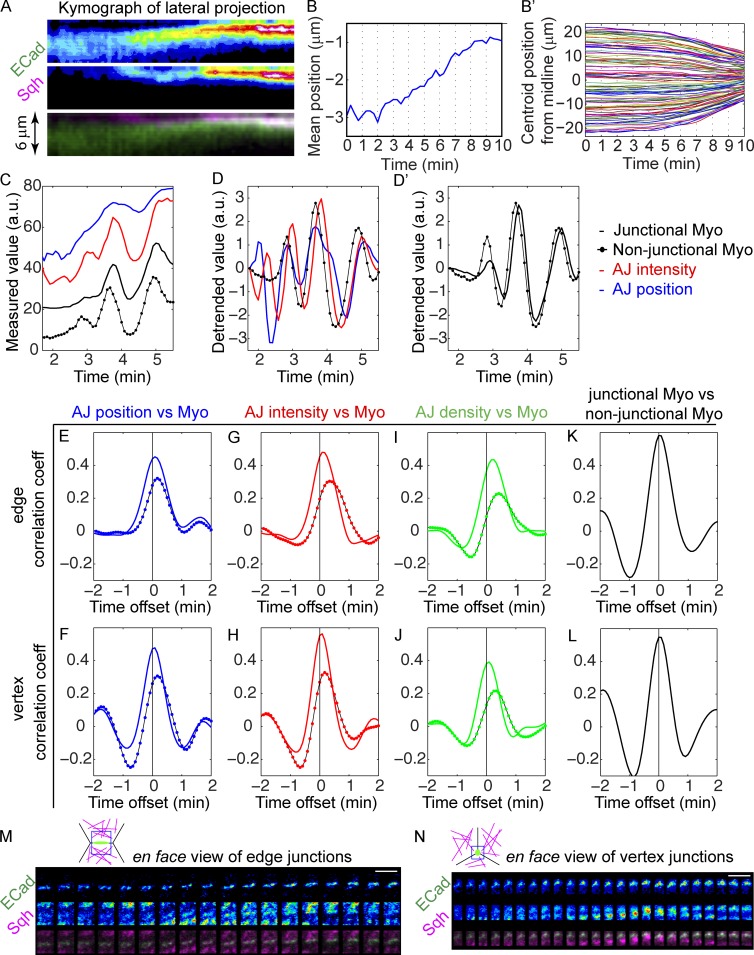
Figure 4.
Features of adherens junctions change in pulses and are temporally correlated with myosin activity in ventral cells. (See also Fig. S3.) (A) Kymographs of E-Cad::GFP and Sqh::mCherry from lateral projections shows junctions begin to move apically and become more intensified upon the apical accumulation of apical myosin. (B) Initiation of junction shift (junction mean position) coincides with cell convergence toward the D–V midline of mesodermal epithelium in the same embryo (B′). 102 mesoderm cells from the same embryo were analyzed. (C and D) An example of the measurements of mean position and total intensity of the tracked junctions and the intensity of junctional myosin and nonjunctional myosin. (D and D′) Data in C are detrended to reveal the pulses of each measurement (see Materials and methods). (D) The overlapping peaks of junction parameters and myosin. Only nonjunctional myosin is shown for clarity. (D′) Junctional myosin and nonjunctional myosin show similar changes. Temporal resolution: 5 s. a.u., arbitrary units. (E–J) Mean correlation coefficients between junction features and myosin intensity in ventral cells (n = 30). Colored solid lines: correlation with the junctional myosin. Solid lines with colored dots: correlation with nonjunctional myosin. Mean intensity of E-Cad signal is used as the junction density. (K and L) Temporal correlations between junctional myosin and nonjunctional myosin. (E, G, I, and K) Analysis of edge junctions. (F, H, J, and L) Analysis of vertex junctions. AJ, adherens junction; Myo, myosin. (M and N) En face views of the tracked junctions and their surrounding medial myosin showing junctional myosin accumulates as medial myosin approaches the junctions. (M) Edge junctions. (N) Vertex junctions. Cartoons show the position of the region of interest relative to the cells: junctions in green, myosin in magenta, and region of interest in blue. Bars, 5 µm. n = 30.

