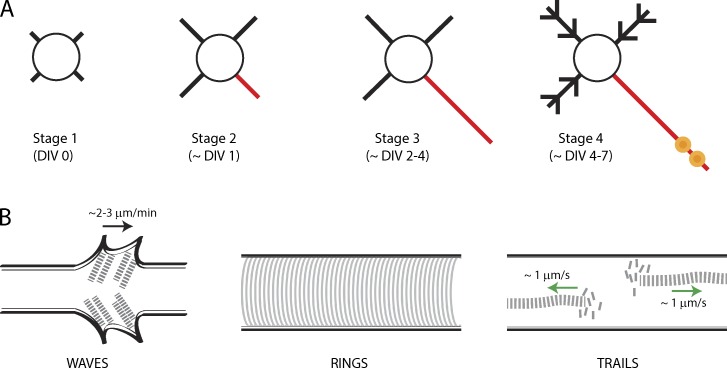
Figure 1.
Various actin assemblies in axons. (A) Schematic depicting maturation of hippocampal neurons in culture. The circle represents the soma while the black lines represent neurites/dendrites. Red line denotes putative/actual axon and yellow circles represent presynaptic boutons. (B) Schematic of axonal actin assemblies described in the text. The black arrow (left) points anterogradely and the green arrows (right) indicate direction of actin polymer growth.

