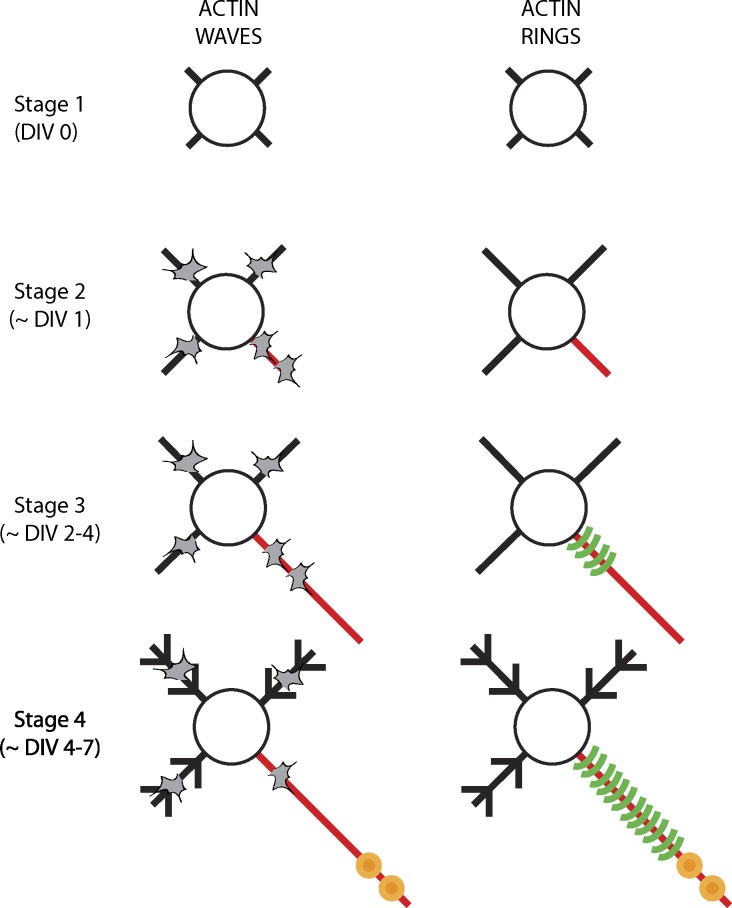
Figure 2.
Evolution of actin assemblies in axons. (left) Schematic showing evolution of actin waves (gray shapes) in cultured hippocampal neurons; number of waves shown reflects relative frequency. Note that waves are seen in all processes but are more frequent in putative/actual axon until stage 3, after which their frequency diminishes. (right) Actin rings first appear in stage 3 neurons, but are restricted to the proximal axons. At stage 4 and later, the rings are seen along distal axonal shafts as well.

