Figure 1.

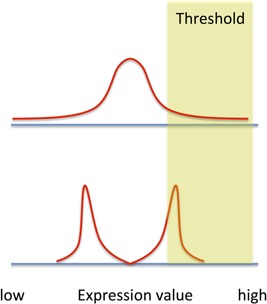
A schematic diagram of two different single cell distributions with identical variance value. If there is a threshold value that triggers some cellular response, the two populations will respond very differently.

A schematic diagram of two different single cell distributions with identical variance value. If there is a threshold value that triggers some cellular response, the two populations will respond very differently.