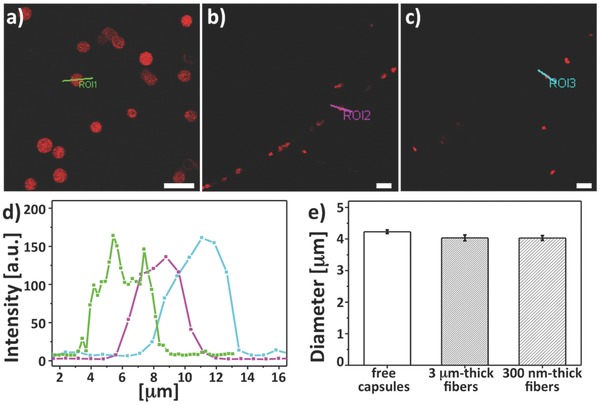
Figure 2.

Confocal analysis of the sensing regions. The CLSM images show a) fluorescent free capsules, b) capsules in 3 μm thick fibers, and c) capsules in 300 nm thick fibers. Scale bar = 10 μm. d) Intensity profiles of the region of interest (ROIs 1–3) marked with a line in the CLSM images reported in panels (a)–(c). e) Average diameter of free capsules (4.2 ± 0.1 μm), capsules in 3 μm thick (4.0 ± 0.1 μm), and capsules in 300 nm thick fibers (4.0 ± 0.1 μm). Columns represent mean ± standard error of mean (number of capsules analyzed = 50).
