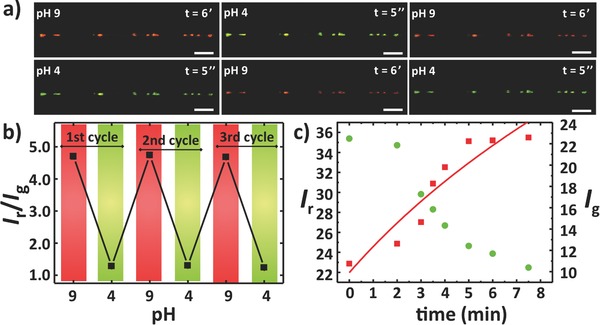
Figure 4.

Reversibility and time response to pH switches. a) Typical reversibility response of hybrid fibers, imaged via CLSM after addition of a drop of solution at pH 9. Next, a drop of solution at pH 4 was deposited onto the same region. The cycle was repeated up to 20 times. Overlay of green (false color, 540–610 nm) and red (620–700 nm) channels recorded at each tested pH. The t values for each frame indicate the time interval after the application of a pH change. Average fiber diameter = 3 μm. Scale bars = 20 μm. b) Red‐to‐green ratio (false colors) of the fluorescence signal I r/I g versus the pH of the solution. c) Fiber temporal response to changes from low (4) to high (9) pH. Left axis for the fluorescent signals measured for red (620–700 nm, squares) channel and right axis for the green (false color, 540–610 nm, circles) channel. Average fiber diameter = 3 μm. Continuous line: best fit to red signal channel data by Equation (1).
