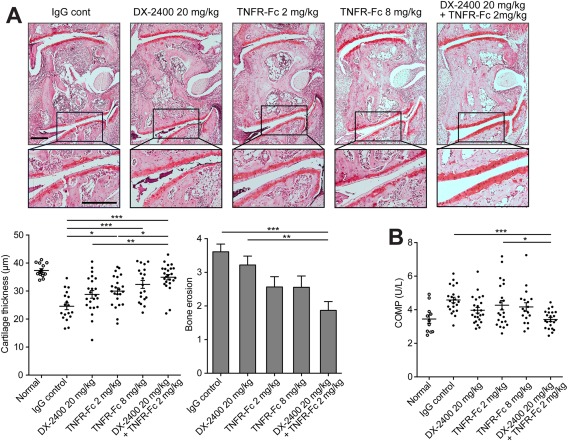
Figure 4.

Prevention of both cartilage degradation and bone erosion following combined inhibition of membrane type 1 matrix metalloproteinase and tumor necrosis factor (TNF) in mice with collagen‐induced arthritis (CIA). A, Histologic analysis of arthritic joints from mice with CIA treated with IgG control, 20 mg/kg of DX‐2400, 2 or 8 mg/kg of TNFR‐Fc fusion protein, or 20 mg/kg of DX‐2400 plus 2 mg/kg of TNFR‐Fc for 10 days from the onset of arthritis. Images at the top are representative images of Safranin O–stained sections of the tarsometatarsal joints. Images at the bottom are higher‐magnification views of the boxed areas in the images at the top. Bar = 200 μm. The mean cartilage thickness (bottom left) and bone erosion scores (bottom right) in the tarsometatarsal joints of mice from the same treatment groups are also shown (n = 18–23 mice per group). For the mean cartilage thickness, each symbol represents an individual mouse; horizontal lines with bars show the mean ± SEM. For the bone erosion scores, values are the mean ± SEM. B, Serum levels of cartilage oligomeric matrix protein (COMP) in normal mice and mice with CIA in the same treatment groups (n = 22–23 mice per group). Each symbol represents an individual mouse; horizontal lines with bars show the mean ± SEM. ∗ = P < 0.05; ∗∗ = P < 0.01; ∗∗∗ = P < 0.001. Color figure can be viewed in the online issue, which is available at http://onlinelibrary.wiley.com/journal/doi/10.1002/art.39414/abstract
