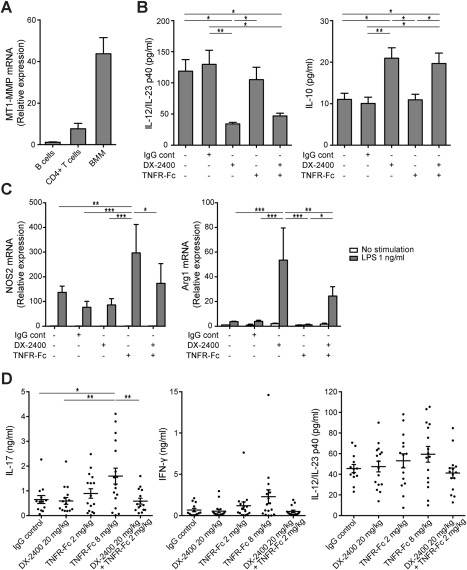
Figure 6.

Promotion of M2 macrophage polarization and inhibition of the Th1/Th17 cell response exerted by treatment with anti–tumor necrosis factor (anti‐TNF) following selective inhibition of membrane type 1 matrix metalloproteinase (MT1‐MMP) in mice with collagen‐induced arthritis (CIA). A, Expression of mRNA for MT1‐MMP in B cells, CD4+ T cells, and bone marrow–derived macrophages (BMMs) from mice with CIA. Expression levels were calculated relative to those in B cells. B, Release of interleukin‐12 (IL‐12)/IL‐23 p40 (left) and IL‐10 (right) from BMMs following 24 hours of stimulation with IgG control or with 1 ng/ml of lipopolysaccharide (LPS) in the presence or absence of 10 nM DX‐2400 and/or TNFR‐Fc. C, Expression of mRNA for M1 (nitric oxide synthase 2 [NOS2]) (left) and M2 (arginase 1 [Arg1]) (right) macrophage markers in BMMs following 24 hours of stimulation with IgG control or with 10 nM DX‐2400 and/or TNFR‐Fc with or without 1 ng/ml of LPS. Expression levels were calculated relative to those in untreated cells. Values in A–C are the mean ± SEM of 3–4 mice per group. D, Release of IL‐17, interferon‐γ (IFNγ), and IL‐12/IL‐23 p40 from lymph node cells stimulated for 48 hours with anti‐CD3 monoclonal antibody. Lymph node cells were obtained from mice with CIA treated with IgG control, 20 mg/kg of DX‐2400, 2 or 8 mg/kg of TNFR‐Fc fusion protein, or 20 mg/kg of DX‐2400 plus 2 mg/kg of TNFR‐Fc 10 days after the onset of arthritis (n = 13–17 mice per group). Each symbol represents an individual mouse; horizontal lines with bars show the mean ± SEM. ∗ = P < 0.05; ∗∗ = P < 0.01; ∗∗∗ = P < 0.001.
