
Figure 3.
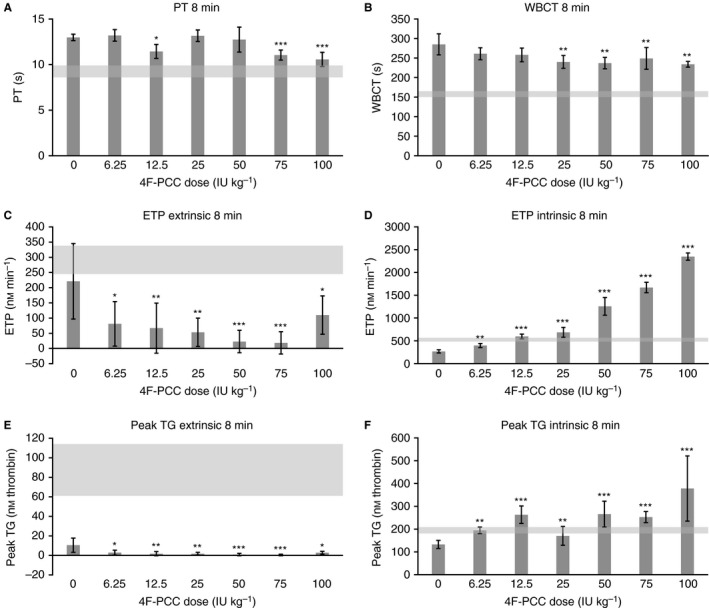
Effects of 4F‐PCC (6.25–100 IU kg−1, i.v.) on (A) PT, (B) WBCT, (C) ETP (extrinsic activation), (D) ETP (intrinsic activation), (E) peak TG (extrinsic activation), and (F) peak TG (intrinsic activation) following apixaban treatment (1200 μg kg−1). PT, WBCT, ETP, and peak TG measured at t = 8 min (5 min after 4F‐PCC administration). Data are mean ± SEM. (A) Gray shaded area denotes baseline ranges for PT (8.6–9.9 s) in vehicle‐treated animals; (B) gray shaded area denotes baseline ranges for WBCT (150–165 s) in vehicle‐treated animals; (C) gray shaded area denotes baseline range for ETP (245–338 nm min−1) following extrinsic activation in vehicle‐treated animals; (D) gray shaded area denotes baseline range for ETP (482–566 nm min−1) following intrinsic activation in vehicle‐treated animals; (E) gray shaded area denotes baseline range for peak TG (61–114 nm thrombin) following extrinsic activation in vehicle‐treated animals; (F) gray shaded area denotes baseline range for peak TG (181–210 nm thrombin) following intrinsic activation in vehicle‐treated animals. *, **, and *** indicate statistical significance at the P < 0.05, P < 0.01, and P < 0.001 levels, respectively, compared with animals that received apixaban plus saline. 4F‐PCC, four‐factor prothrombin complex concentrate; ETP, endogenous thrombin potential; IU, international units; PT, prothrombin time; SEM, standard error of the mean; TG, thrombin generation; WBCT, whole blood clotting time.