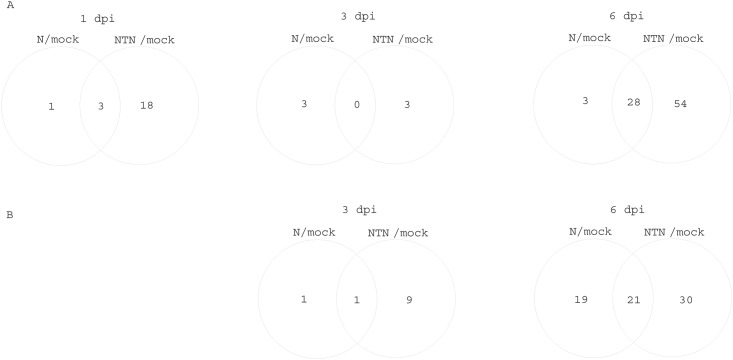
Fig 2. Venn diagrams showing the numbers of statistically significantly differentially accumulated metabolites at the different times in the inoculated leaves (A) and non-inoculated leaves (B).
Diagrams are showing the number of metabolites in PVYN-inoculated and PVYNTN-inoculated leaves, relative to the mock-inoculated leaves (N/mock, NTN/mock, respectively). The intercept areas show the numbers of metabolites that were common to both of the plant responses in the comparisons.

