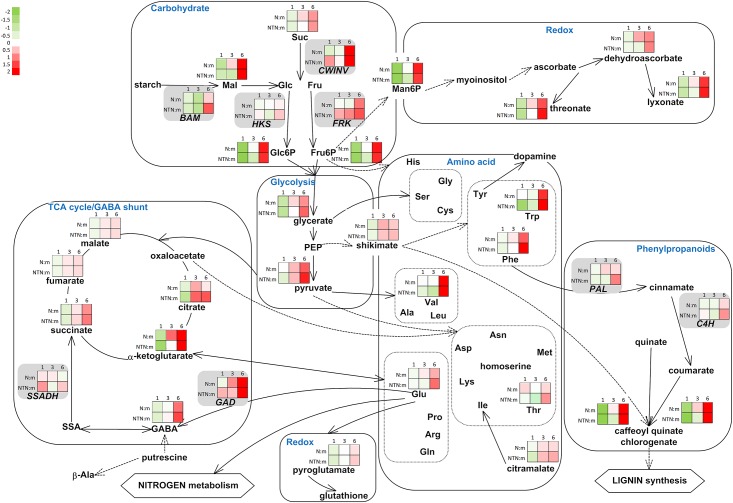
Fig 3. Integration of the changes in the metabolites and transcripts associated with selected metabolic pathways in the PVYN-inoculated and PVYNTN-inoculated leaves, relative to the mock-inoculated leaves.
The metabolites identified and the genes analysed from the primary and secondary metabolism and from redox reactions are shown. Each coloured square represents the log2 ratios of the expression or abundance (red, high; green, low) at 1, 3 and 6 dpi in the PVYN-inoculated (N:m) and PVYNTN-inoculated (NTN:m) leaves, relative to the mock-inoculated leaves (as indicated). MapMan BINs linked to primary metabolism: 2.1.1 major CHO metabolism, sucrose synthesis; 2.2.1 major CHO metabolism, sucrose degradation; 2.2.2 major CHO metabolism, starch degradation. MapMan BINs linked to the GABA shunt: 13.1.1.1 amino-acid metabolism, GABA synthesis; 8.1. TCA; 22. polyamine metabolism; 12.2.1002 N-metabolism, ammonia. MapMan BINs linked to secondary metabolism: 16.2.1 secondary metabolism, phenylpropanoids biosynthesis; 13.1. amino-acid synthesis.

