
Figure 1.
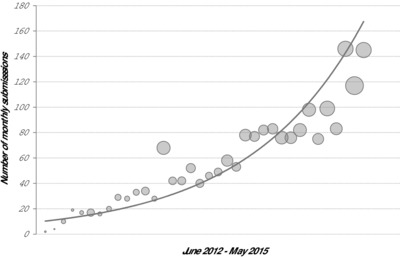
The amount of publicly available proteomics data is increasing, here indicated by the monthly submission statistics for PRIDE from June 2012 to May 2015. The x‐axis represents the months and the y‐axis the monthly number of submissions. The size of the bubbles indicate the data amount submitted each month. Note that the cumulative size of PRIDE data reached the 100 TB milestone in April 2015.