
Figure 1.
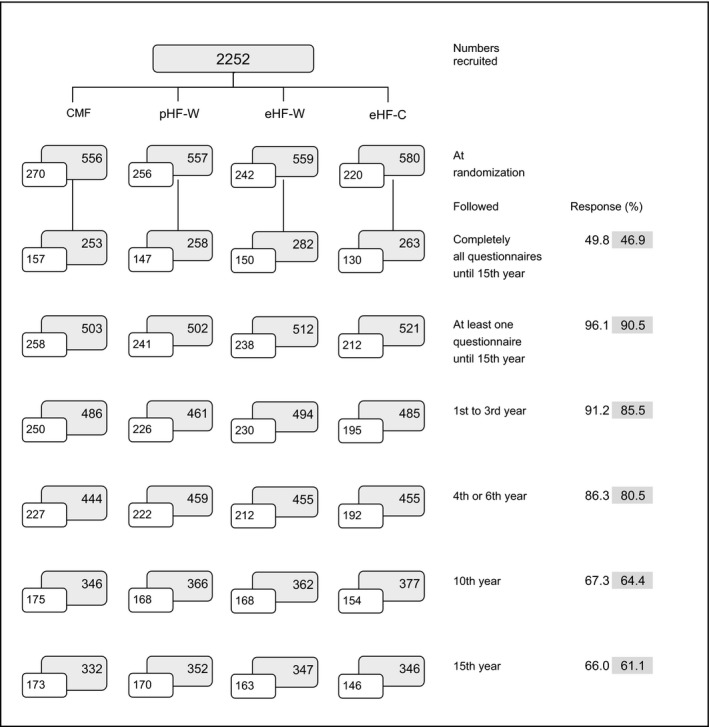
GINI study profile from birth to 15 years. Number of children followed and participation (%) for the ITT (shaded boxes) and PP (open boxes) population are shown.
Official websites use .gov
A
.gov website belongs to an official
government organization in the United States.
Secure .gov websites use HTTPS
A lock (
) or https:// means you've safely
connected to the .gov website. Share sensitive
information only on official, secure websites.
GINI study profile from birth to 15 years. Number of children followed and participation (%) for the ITT (shaded boxes) and PP (open boxes) population are shown.