Figure 1.

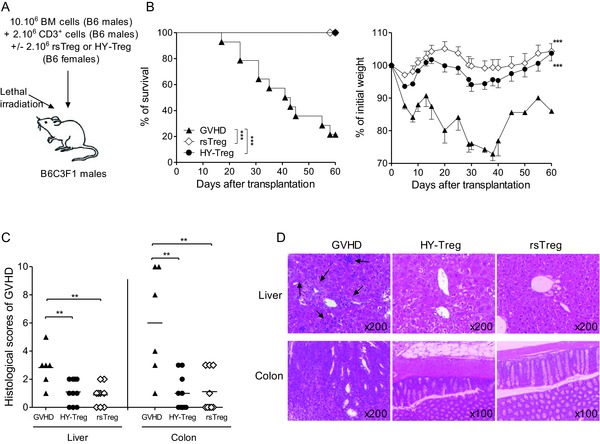
HY‐Treg cells exert the same immunosuppressive effect in vivo as rsTreg cells. (A) Experimental GVH disease model representing semiallogenic HSC transplantation testing different Treg‐cell populations. (B) Kaplan–Meier survival and weight (mean ± SEM) curves from mice injected with BM cells plus T cells alone (GVH disease group, n = 16) or with HY‐Treg cells (n = 13) or rsTreg cells (n = 11). (C) Histopathological scores of colon and liver after semiallogeneic HSC transplantation. Grading of GVH disease was performed 60 days after transplantation. Symbols correspond to histopathological score of individual mice, and horizontal bars show the mean histopathological score for each group. (B, C) Data shown are pooled from four experiments performed. **p < 0.01, ***p < 0.001, two‐tailed unpaired Student's t‐test and log‐rank (Mantel–Cox) test for survival between two mice groups. (D) H&E‐stained histological sections of colon and liver from one representative mouse per group 60 days after allo‐HSC transplantation. Arrows indicate cell infiltrates. Data shown are representative of four experiments performed.
