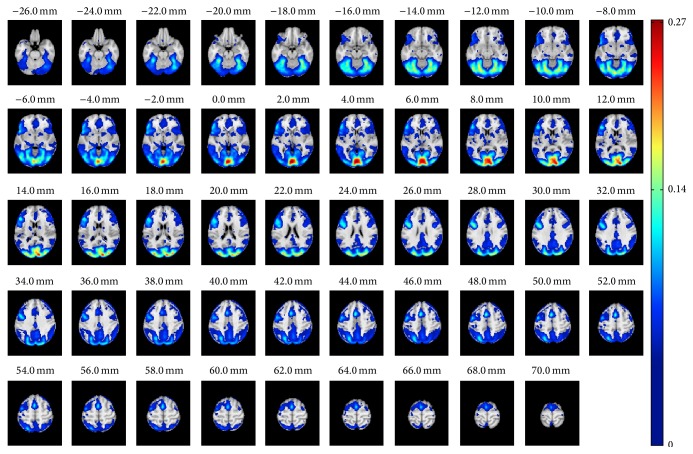
Figure 1.
The ISC analysis based on 130 subjects. The figure presents the axial slices of the ISC analysis results of the whole 130 subjects' data set after applying FDR corrected q = 0.001 thresholding. The full statistical map is visible and available in NeuroVault: http://www.neurovault.org/collections/WTMVBEZP/images/11576/.

