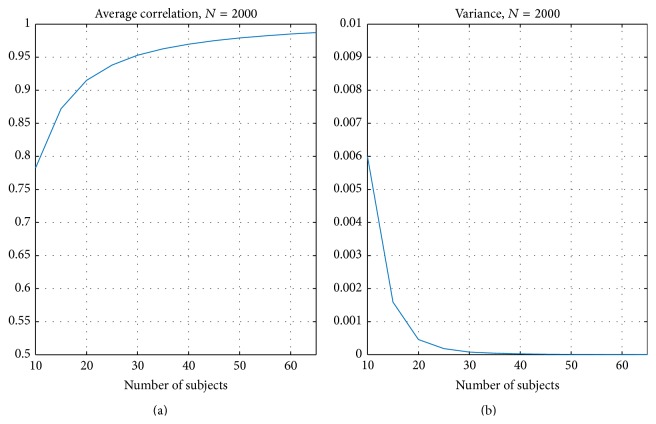
Figure 6.
Average correlation comparing subsampled ISC maps with the ISC statistic map of the whole 130 subjects. (a) presents the average correlation over 2000 replications and (b) presents the corresponding variance. Again, the correlation increased when the number of subjects increased. With 30 subjects or more, the average correlation was greater than 0.95 and the variance was less than 0.0002.

