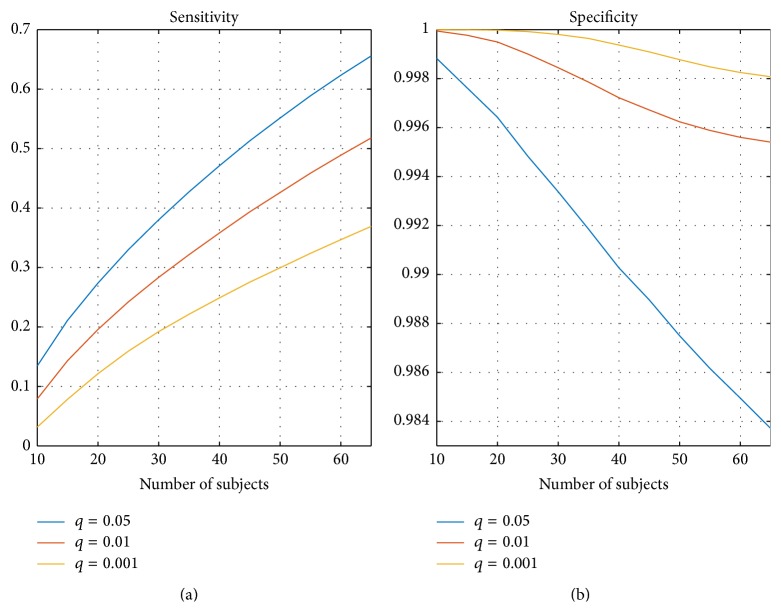
Figure 7.
Average sensitivity and specificity from thresholded binary maps compared with the thresholded ISC statistic map of the full 130-subject sample size. (a) presents the average sensitivity over N = 2000 replications and (b) presents the corresponding specificity. The sensitivity increased when the number of subjects increased. The specificity was close to 1 with conservative thresholds and even with the most liberal threshold with q = 0.05 the specificity was over 0.98 with any number of subjects.

