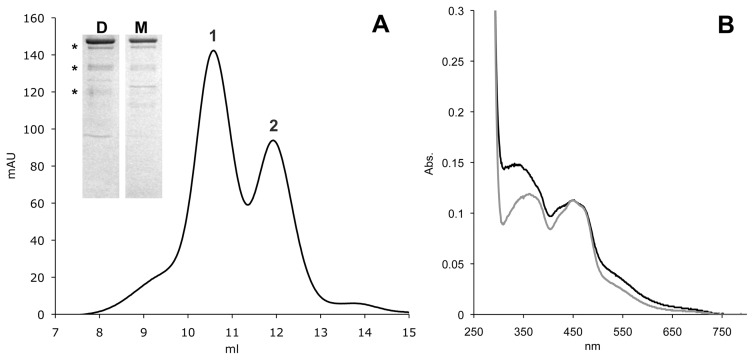
Fig. 1.
Characterization of hAOX1. Shown are the size-exclusion chromatogram of Superdex 200-purified hAOX1 and its UV/Vis absorption spectrum. A, elution profile of a size-exclusion chromatography (Superdex 200) shows two peaks of wild-type hAOX1 protein corresponding to the dimeric (1) and monomeric (2) forms in solution. The purity of the protein was determined by SDS-PAGE (D, dimer; M, monomer). Stars indicate the degradation products of hAOX1 as determined by mass spectroscopy. B, UV/Vis spectrum of air-oxidized hAOX1 in 50 mM Tris (pH 7.5) at 25°C showing characteristic absorptions of the protein-bound FAD at 450 nm and a shoulder for the iron-sulfur clusters at 550 nm. The spectrum of the protein dimer is shown in black, and the spectrum of the monomeric portion is shown in gray.

