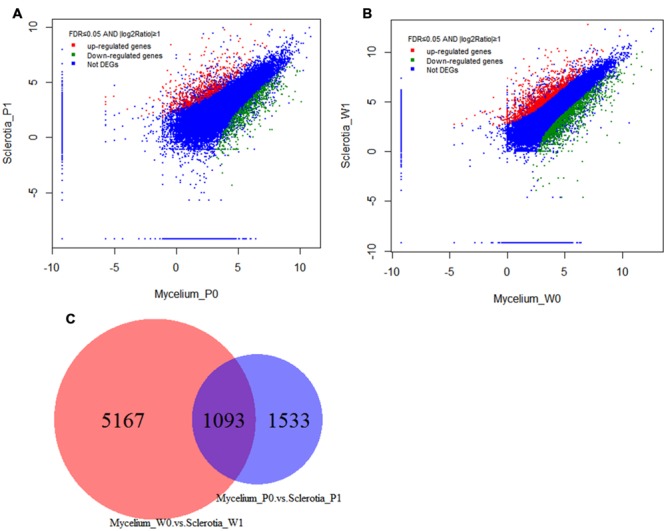
FIGURE 5.

Gene transcription profile between mycelium and sclerotial stages. Scatter plot of total unigenes from the W. cocos transcriptome. The data was normalized as RPKM values and represented on a log10 scale. Red areas represent up-regulated unigenes in sclerotia, green areas represent down-regulated unigenes in the sclerotia and the blue areas represent no significant expression difference unigenes between mycelium and sclerotia. (A) Sclerotia_P1 and Mycelium_P0 were from the data set sequence in this project. (B) Sclerotia_W1 and Mycelium_W0 were from Shu et al. (2013). (C) Differentially expressed unigenes in both data sets.
