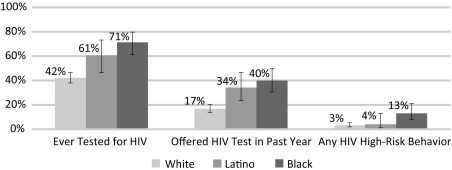
Figure 2. Prevalence patterns in HIV testing and high-risk behavior, age 35-64, by race/ethnicity, Monroe County, New York, 2012.
Total study population included 1,073 respondents (weighted total of 442,000): 799 (346,000) Whites, 108 (31,000) Latinos, and 166 (65,000) Blacks. For each percentage, the vertical error bar represents the 95% CI. Differences between percentages were considered statistically significant if the CIs were non-overlapping. Final point estimates and variances were determined using survey-specific procedures (Stata version 12, College Station, Texas, 2011).

