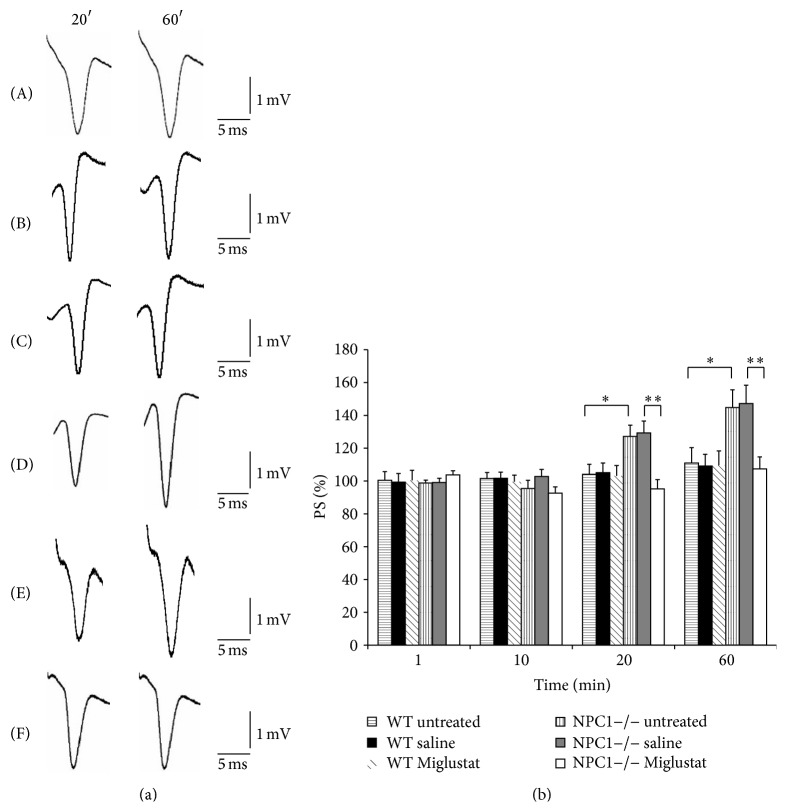
Figure 1.
Basal synaptic transmission in CA1 hippocampal subfield in slices obtained from WT and NPC1−/− mice. (a) Recordings were acquired at times t = 20 and t = 60: curves (A), (B), and (C) refer to WT untreated, WT saline treated, and WT Miglustat treated mice slices, whereas curves (D), (E), and (F) represent the PS of NPC1−/− untreated, NPC1−/− saline, and NPC1−/− Miglustat treated mice. (b) % PS amplitude as a function of time is shown in WT untreated (horizontal pattern bar, n = 8), in WT saline treated (black bar n = 5), in WT Miglustat treated (diagonal pattern bar, n = 5), in NPC1−/− untreated (vertical pattern bar, n = 8), in NPC1−/− saline treated (grey bar, n = 5), and in NPC1−/− Miglustat treated (white bar, n = 11) mouse slices at minutes 1, 10, 20, and 60. PS amplitude corresponds to an average of 6 recordings/min. Bars in the plot are means ± SEM of values obtained from different slices. Note significant statistical differences in PS amplitude during 1-hour recording: at 20 min recording 127.1 ± 6 versus 104.1 ± 6.1, respectively, in NPC1−/− and WT slices of untreated mice (∗ p < 0.05) and 95.2 ± 5.6 versus 129.4 ± 7.2, respectively, in NPC1−/− slices of Miglustat and NPC1−/− slices of saline treated mice (∗∗ p < 0.01); at 60 min recording 144.7 ± 10 versus 111 ± 9 in NPC1−/− and WT slices of untreated mice (∗∗ p < 0.01) and 107.3 ± 7.3 versus 147.2 ± 11 in NPC1−/− slices, respectively, of Miglustat and saline treated mice (∗∗ p < 0.01).

