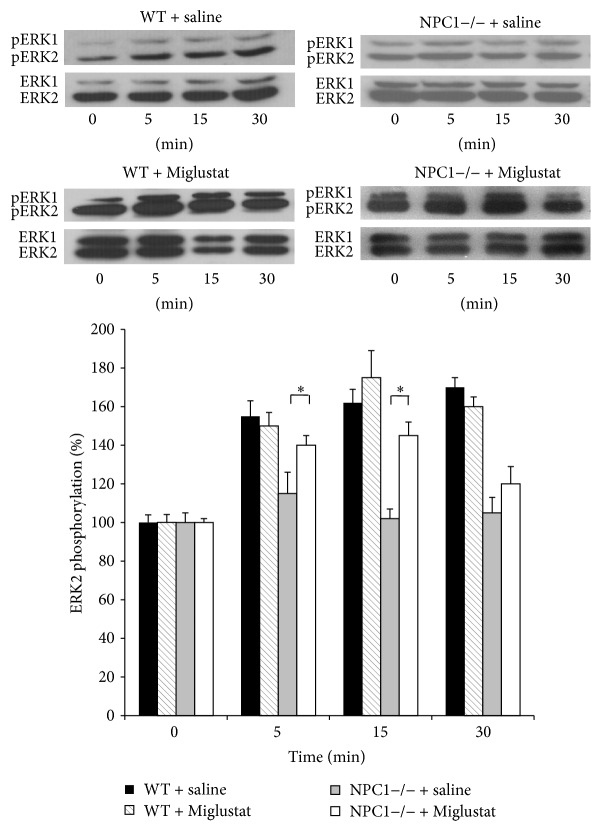
Figure 4.
Effects induced by Miglustat treatment on the activation of ERK1/2 during LTP in WT and NPC1−/− treated mice. The immunoreactive levels of activated and total kinases at the indicate times are shown for a representative experiment in the upper panels; normalized values (means ± SEM) of activated kinases are illustrated in the lower panel (n = 5 for NPC1−/− mice treated with Miglustat; ∗ p < 0.05 versus untreated NPC1−/− mice at the corresponding time point).

