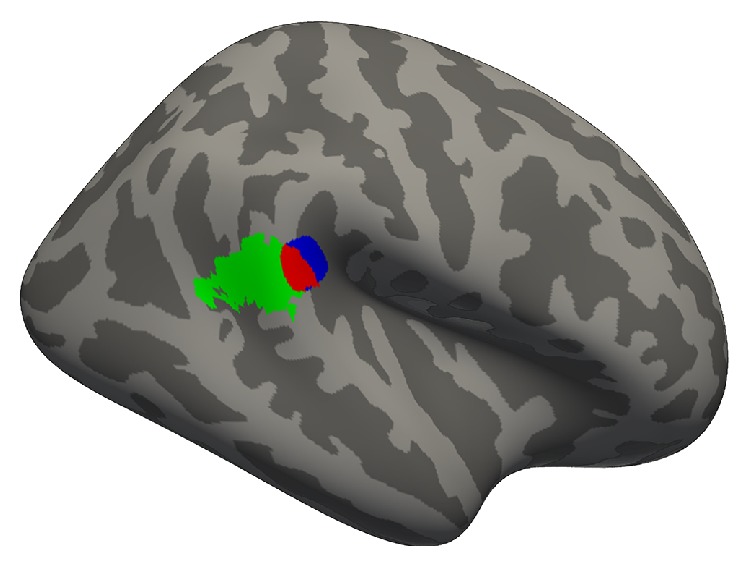
Figure 3.

Overlap (red) between the region in the right PTR where cortical thickness predicts visual motion detection thresholds (blue + red) and a region of visual motion-related cross-modal activity in deaf people from Shiell et al. (2015) [25] (green + red).
