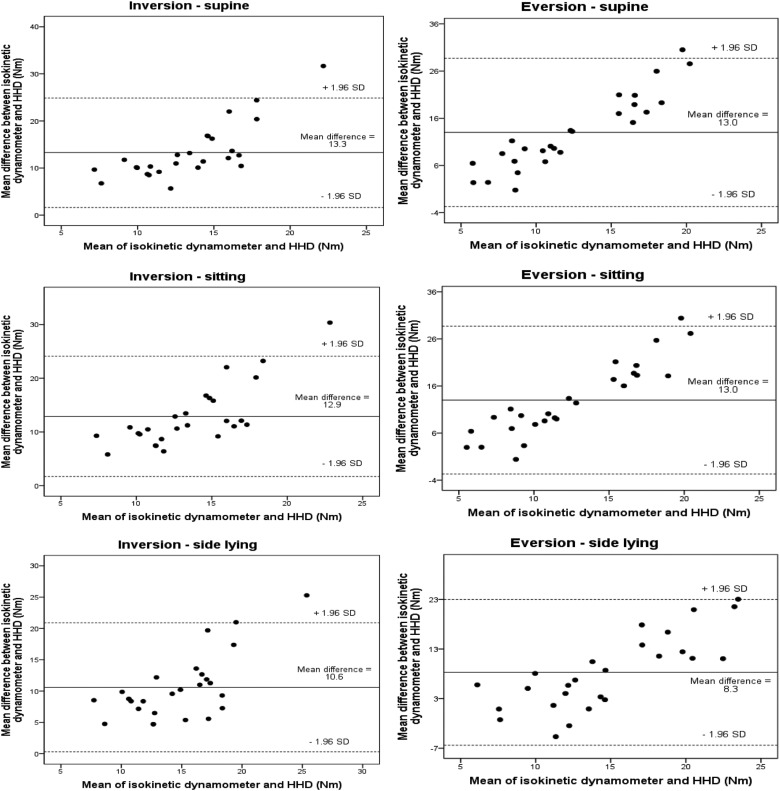
Figure 7.
Bland-Altman plots illustrating the difference (y-axis) compared with the mean (x-axis) of foot inversion and eversion torques (Nm) using a hand-held dynamometer (HHD) and isokinetic dynamometer. The middle line characterizes the mean difference between the HHD and isokinetic dynamometer. The upper and lower dashed lines demonstrate the 95% limits of agreement.

