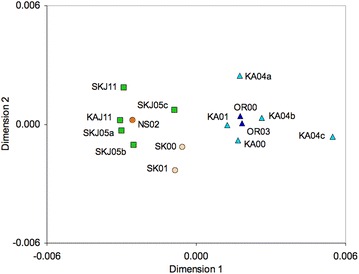
Fig. 1.

Multi-dimensional scaling plot. Based on pairwise F ST for adult spawning populations collected in the North Sea (orange), western Skagerrak (yellow), Kattegat (light blue) and Öresund (dark blue), and juvenile 0-group cod collected in eastern Skagerrak and Kattegat (green). Cod samples are as in Table 2 and Fig. 3
