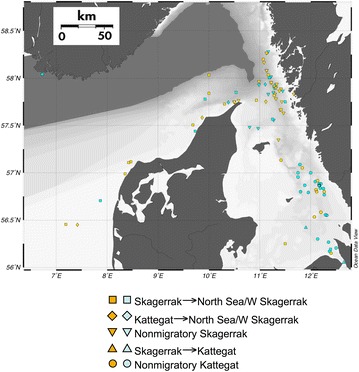
Fig. 2.

Positions of recaptured individual tagged cod. Symbol shape denotes migratory behaviour. Note that some fish that were geolocated west of 10°E and thus considered to have been migrating towards the North Sea were recaptured further east. Yellow denotes individuals genetically assigned to the pooled North Sea/W Skagerrak spawning populations and blue individuals assigned to the pooled Kattegat spawning populations. The map was constructed using Ocean Data View (Schlitzer R, Ocean Data View, http://www.odv.awi.de)
