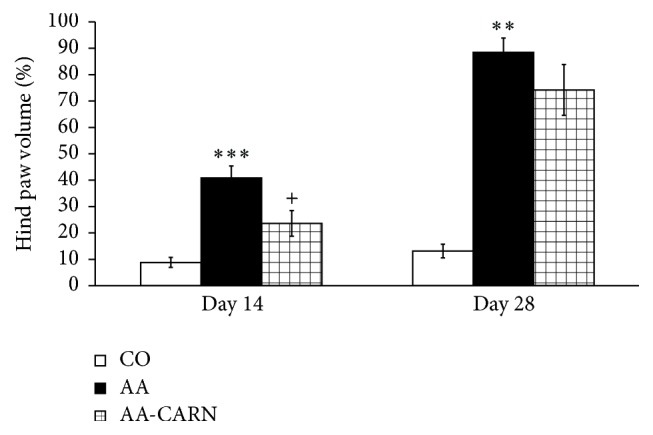
Figure 2.

Changes in hind paw volume of animals in adjuvant arthritis. The data are expressed as arithmetic mean with S.E.M. Each group contained 8–10 animals. ∗∗∗ p < 0.001 and ∗∗ p < 0.01 with respect to control healthy animals; + p < 0.05 with respect to untreated arthritic animals. Groups of animals are the same as in Figure 1.
