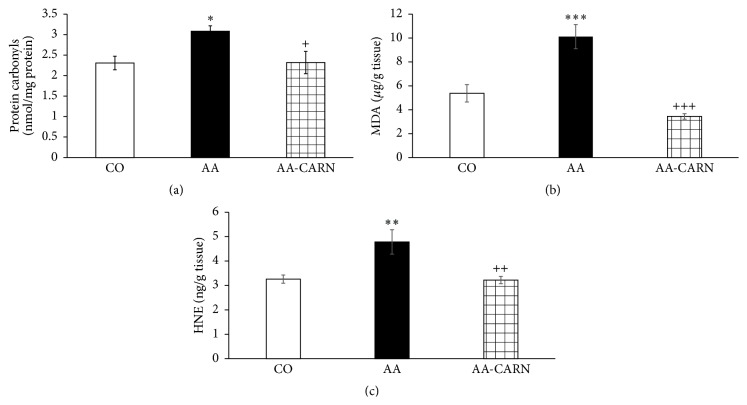
Figure 7.
Level of protein carbonyls (a), MDA (b), and HNE (c) in brain tissue of rats with adjuvant arthritis. The data are expressed as arithmetic mean with S.E.M. Each group contained 8–10 animals. ∗ p < 0.05, ∗∗ p < 0.01, and ∗∗∗ p < 0.001 with respect to control healthy animals; + p < 0.05, ++ p < 0.01, and +++ p < 0.001 with respect to untreated arthritic animals. Groups of animals are the same as in Figure 1.

