Figure 3.

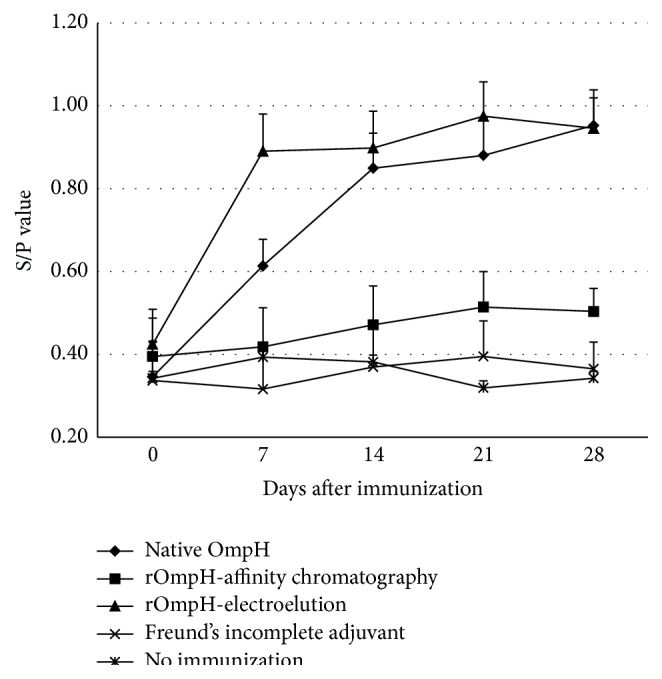
The temporal pattern of the average S/P value of chicken sera (including standard error) based on indirect ELISA (ProFLOK) for each of the five treatment groups (first vaccination on day 0 and the second on day 14).

The temporal pattern of the average S/P value of chicken sera (including standard error) based on indirect ELISA (ProFLOK) for each of the five treatment groups (first vaccination on day 0 and the second on day 14).