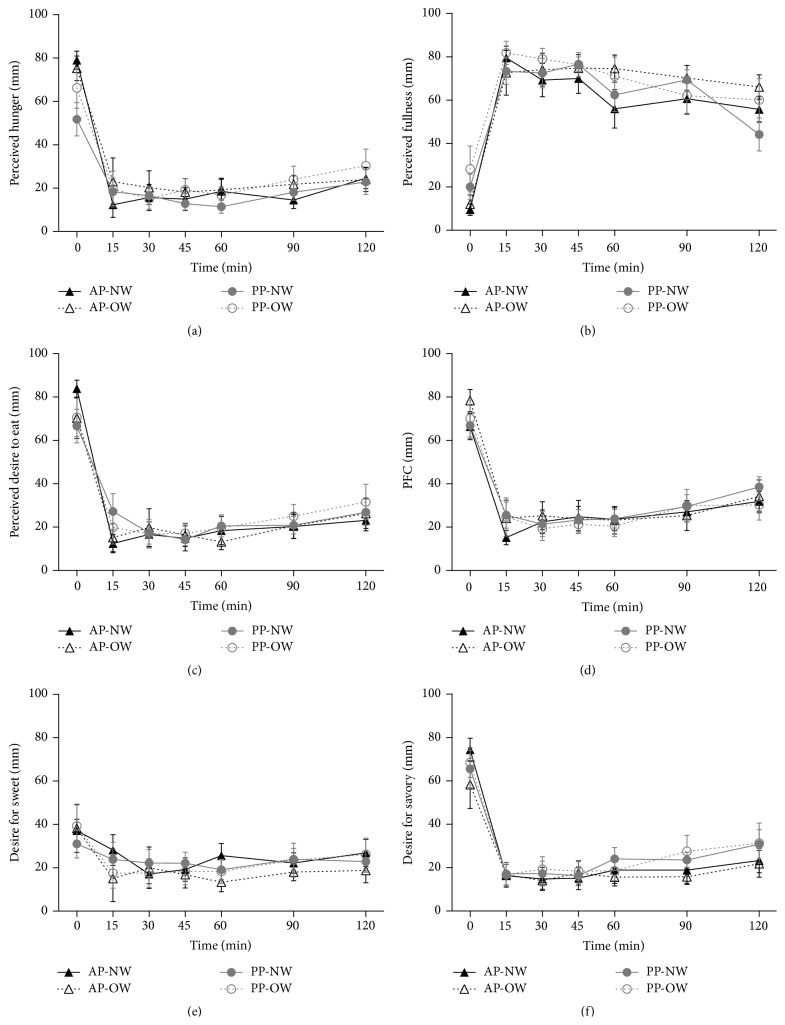
Figure 2.
Appetite responses following test breakfasts. Values expressed as means ± SEM. Data are depicted as appetite rating over time per weight group and breakfast type and net incremental area under the curve (niAUC). (a) Perceived hunger. (b) Perceived fullness. (c) Perceived desire to eat. (d) Prospective food consumption. (e) Desire for something sweet. (f) Desire for something savory. AP: animal protein; NW: normal weight; OW: overweight; PP: plant protein.

