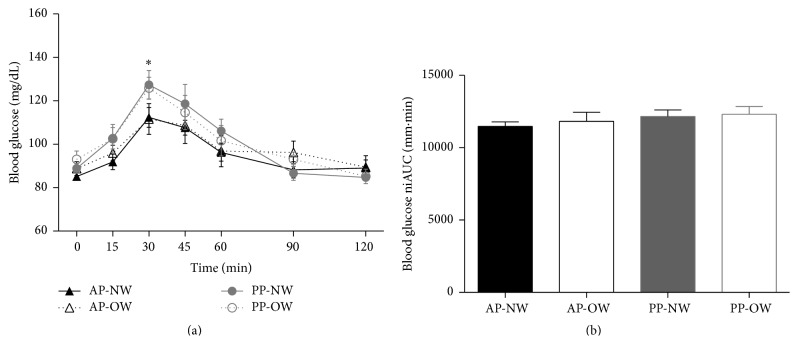
Figure 3.
Glucose response to the test breakfasts. (a) Glucose response to the test breakfasts over time. (b) Glucose net incremental area under the curve (niAUC). Values expressed as means ± SEM. ∗ indicates that blood glucose values for AP were significantly different than PP (P < 0.05). AP: animal protein; NW: normal weight; OW: overweight; PP: plant protein.

