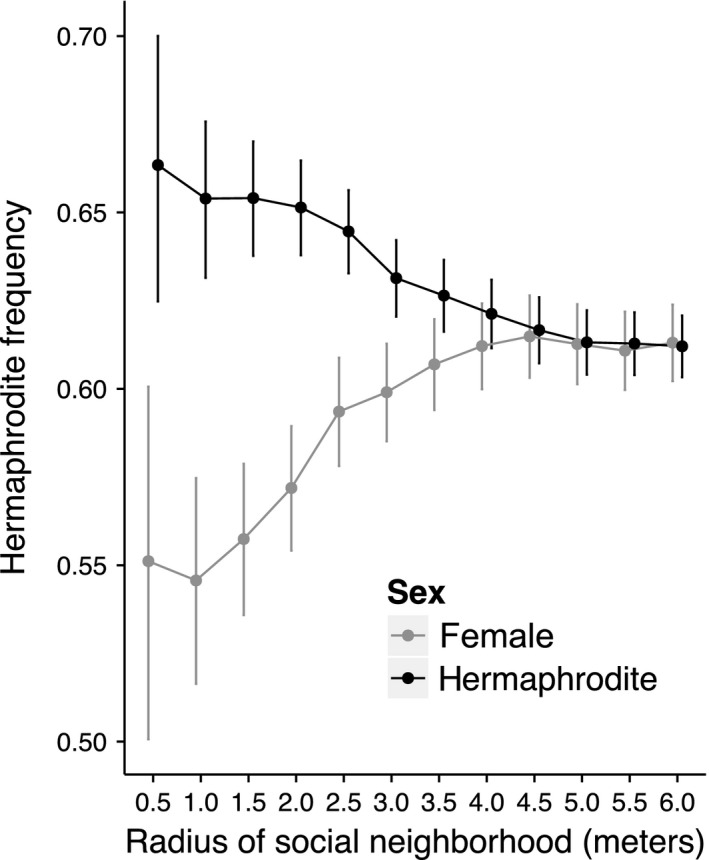
Figure 2.

Hermaphrodite frequency experienced by hermaphrodites (black) and females (gray) across spatial scales measured in radii from 0.5 m to 6.0 m. The points are least square means of hermaphrodite frequency regressed on sex, radius of spatial scale, the sex‐by‐scale interaction as fixed effects, and plant ID as a random effect. Lines represent 95% confidence intervals of the LS means.
