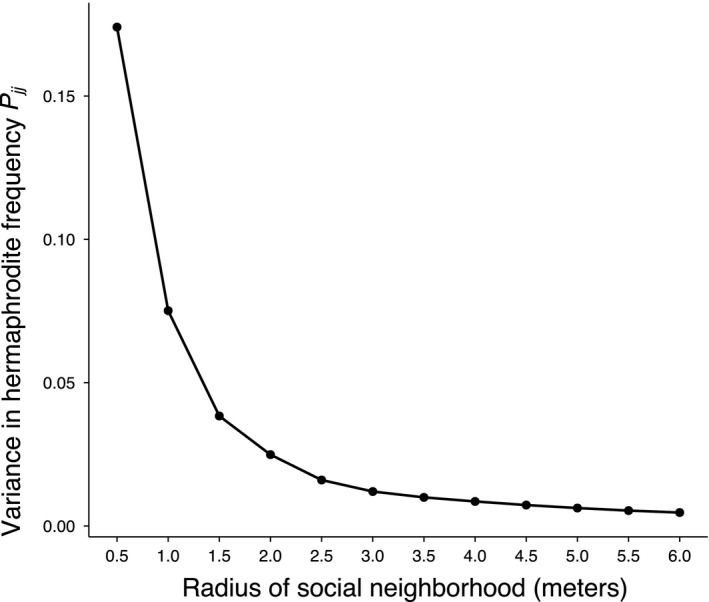
Figure 3.

Variation in local hermaphrodite frequency decreases continuously with increasing spatial scale. Each point represents the variance in local hermaphrodite frequency assessed at spatial scales along the X‐axis from 0.5 m to 6.0 m in 0.5 m steps.
