
Fig. 1.
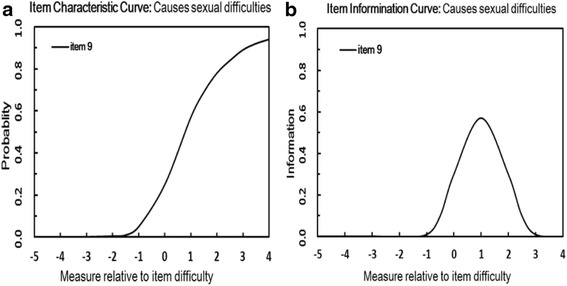
Item characteristic curve and item information curve for item 9. The curves represent the item as high difficulty − low discrimination because it is more likely to be endorsed at high levels of severity. However, it is relatively imprecise in measuring individual differences among respondents. X-axis - the latent trait of HRQoL. Y-axis - the probability of participant response. a Item Character Curve, b Item Information Curve