Fig. 2.

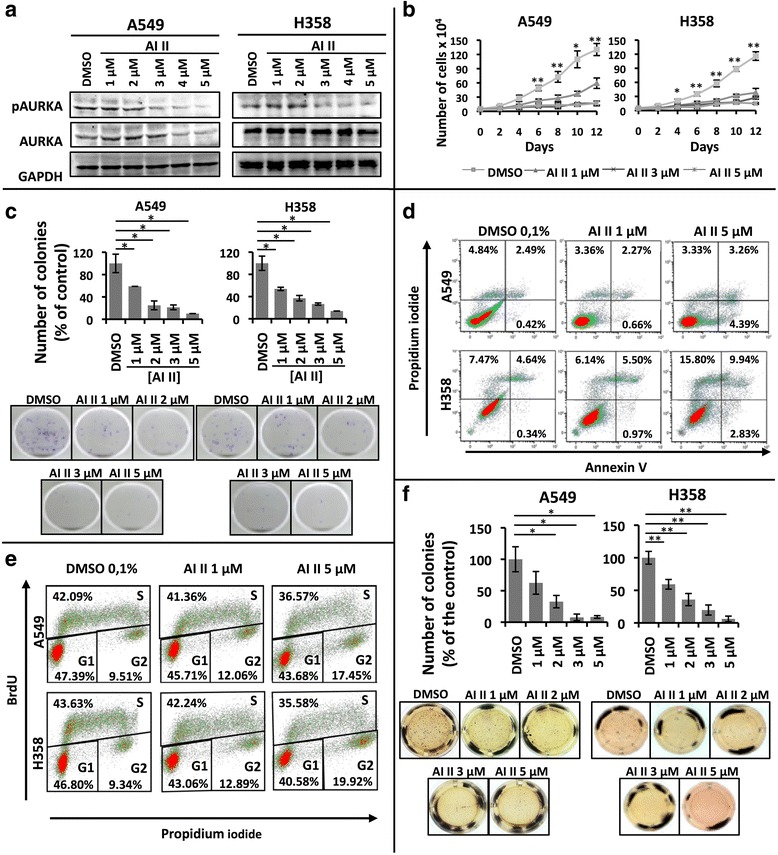
Dual pharmacological inhibition of AURKA and AURKB decreases the transformed phenotype of KRAS-positive lung cells. a A549 and H358 cells were treated with 0.1 % DMSO or increasing concentrations of AI II as indicated for 72 h and protein lysates were prepared and submitted to Western blotting with the indicated antibodies. b Growth curve analysis of A549 and H358 cells treated with the indicated concentrations of AI II compared to control-treated cells (0.1 % DMSO) for the indicated times. c A549 and H358 cells were plated for clonogenic assays as described in methods and treated for 21 days with either 0.1 % DMSO or different concentrations of AI II as indicated. Colonies formed were stained with crystal violet and counted. Images shown are representative of three independent experiments. d A549 and H358 cells were treated with 0.1 % DMSO or increasing concentrations of AI II as indicated for 72 h, stained for Annexin V and propidium iodide (PI) as described in methods and Annexin V positive cells were analyzed by flow cytometry. e A549 and H358 cells were treated with 0.1 % DMSO or increasing concentrations of AI II as indicated for 72 h, cells were stained with BrdU and PI as described in methods, and cell cycle analysis was performed by flow cytometry. f Anchorage-independent growth was evaluated by plating A549 and H358 in soft agar as described in methods. Cells were then treated for 21 days with either 0.1 % DMSO or different concentrations of AI II as indicated. Colonies formed were stained with MTT and counted. Images shown are representative of three independent experiments. In all cases, statistical significance was determined when appropriate by Student’s t-test (*p < 0.05, **p < 0.01) by comparing AI II-treated vs. DMSO-treated samples. Error bars represent average ± 1 s.d
