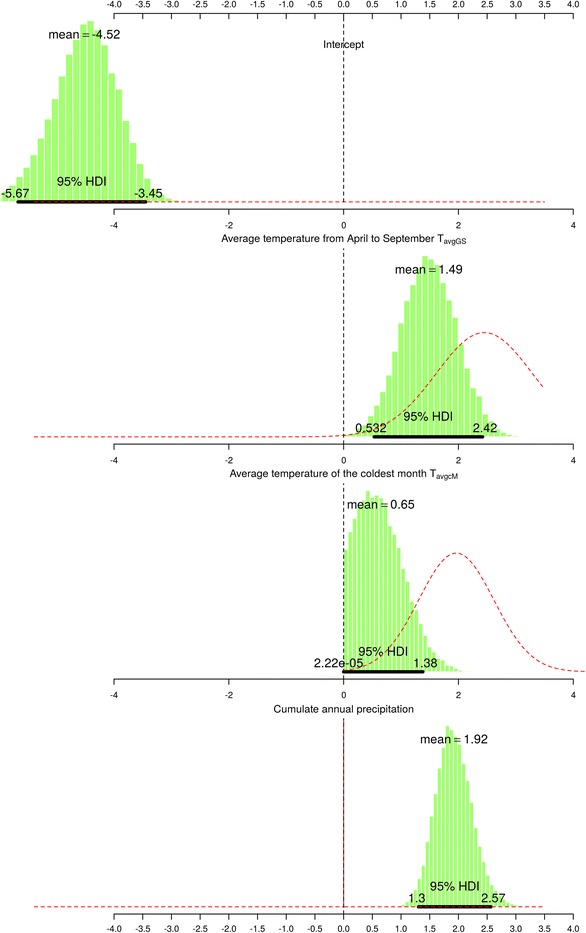
Fig. 7.

Posterior Probability Distribution for the best model parameters: The red dashed lines represent the distribution of the priors while the black horizontal line is the 95 % High Density Interval of the distribution. The distribution average, lower and upper bound of 95 % HDI were also reported in the figure
