Fig. 2.

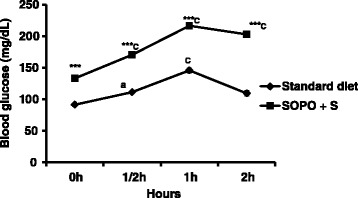
Oral glucose tolerance test in animals receiving hypercaloric diet (SOPO + S). Each point represents mean ± SEM, n = 5. ***p < 0.001 vs. standard diet; a p < 0.05; c p < 0.001 vs. initial value

Oral glucose tolerance test in animals receiving hypercaloric diet (SOPO + S). Each point represents mean ± SEM, n = 5. ***p < 0.001 vs. standard diet; a p < 0.05; c p < 0.001 vs. initial value