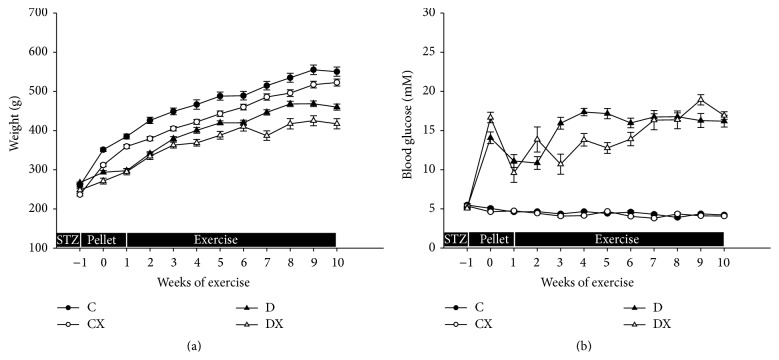
Figure 1.
(a) Weekly body weights: C, sedentary control (n = 16); CX, control exercise (n = 16); D, sedentary T1DM (n = 15); DX, T1DM exercise (n = 12). (b) Weekly blood glucose concentrations: C (n = 16); CX (n = 15); D (n = 15); DX (n = 13). STZ, pellet, and exercise indicate the periods of STZ injection, insulin pellet implantation, and aerobic exercise, respectively. Significantly different groups (p < 0.05). Data are mean ± SE. There was significant difference in body weight between T1DM and non-T1DM groups, while a significant difference was evident between exercised and nonexercised groups. The blood glucose concentrations in the T1DM groups were significantly different than non-T1DM groups.

