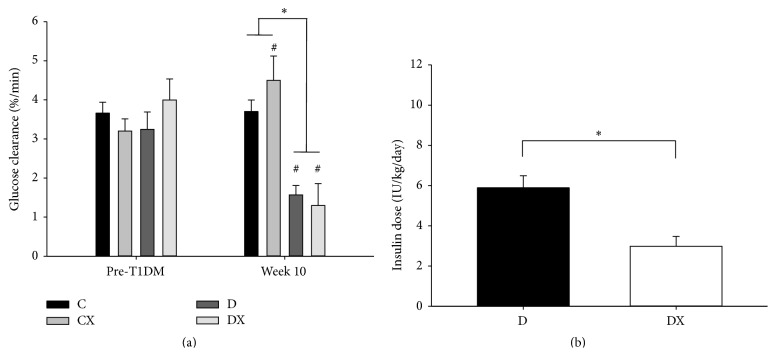
Figure 2.
(a) IVGTT glucose clearance rate (K G) values prior to T1DM induction (pre-T1DM) and week 10 of exercise training: C, sedentary control (n = 16); CX, control exercise (n = 15); D, sedentary T1DM (n = 15); DX, T1DM exercise (n = 15). (b) Insulin dosages at week 10: D (n = 16); DX (n = 16). ∗Significantly different groups (p < 0.05). #Significantly different from week 1. Data are mean ± SE.

