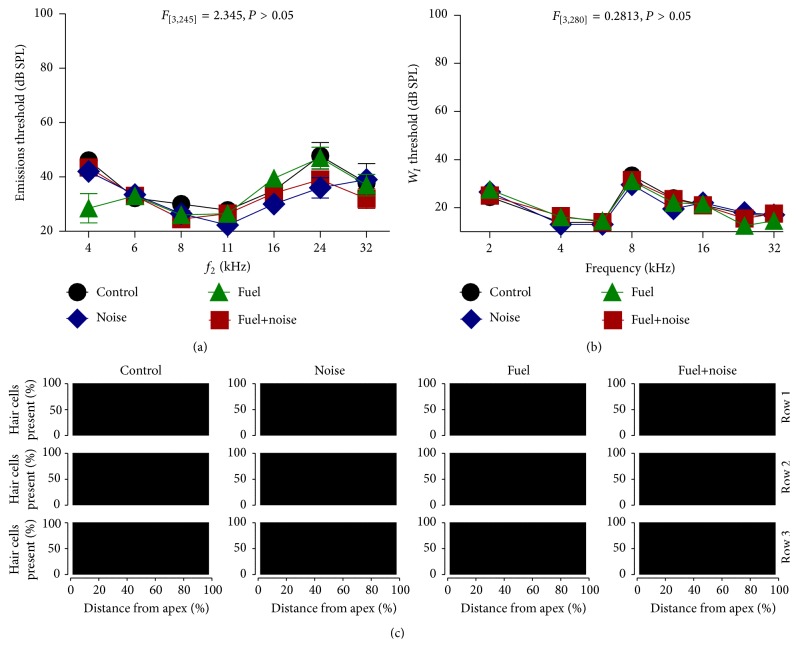
Figure 1.
Normal thresholds. (a) Emissions thresholds revealed no major differences in preneural sensitivity between the experimental groups. (b) Synchronous compound action potential (W I) also revealed no major differences in neural sensitivity between the experimental groups. (c) Cytocochleograms showed no loss (all black) of sensory cells (outer hair cells) as a function of distance along the neurosensory epithelium. Error bars in this and all figures are ±1 standard error.

