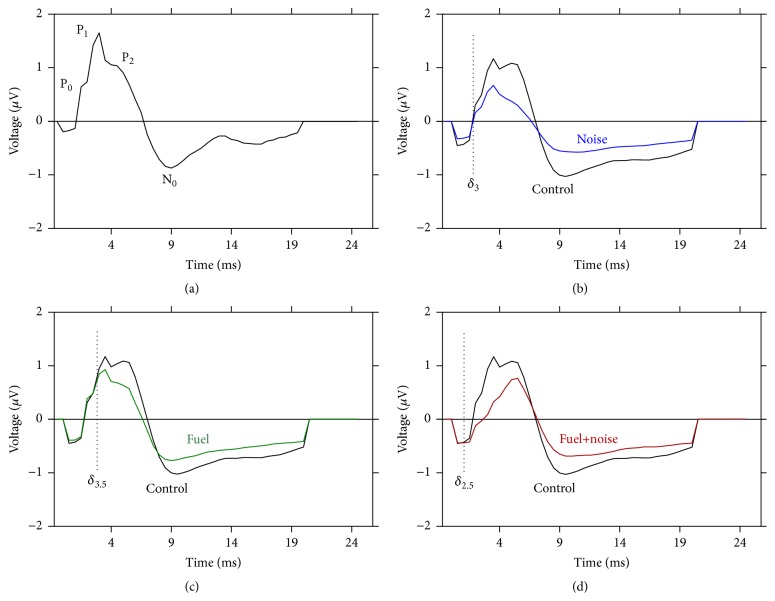
Figure 2.
Abnormal SVP. (a) A typical SVP with three positive components (P0, P1, and P2) followed by a negative component (N0). (b) Grand average SVP from the control group compared with that from the noise exposed group. Note that the noise exposure suppressed the amplitude of P1, P2, and N0 which resulted in a truncated waveform. (c) Similar, but less severe outcomes were observed after fuel-only exposure. (d) Combined exposure to both the fuel and noise resulted in a loss of P0 and P1 combined with suppression of P2 and N0. Furthermore, the overall waveform is truncated. The vertical dotted lines demark the point in time where the instantaneous voltage trace deviated (δ) from normal. Note that fuel+noise exposure exhibited the earliest deviation at 2.5 ms. These instantaneous voltage traces were recorded with a 70 dB SPL rectangular voltage pulse.

