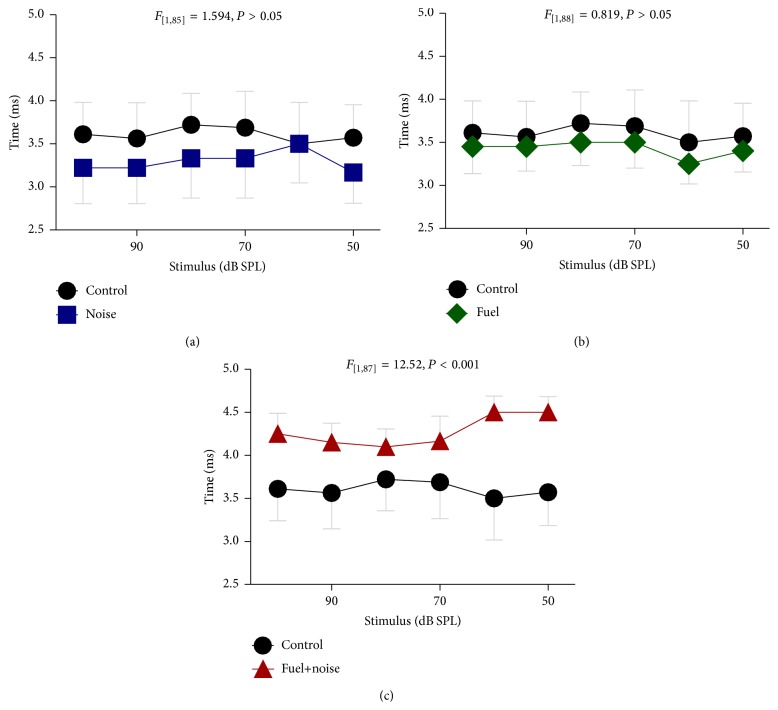
Figure 3.
Abnormal conduction time. The time difference between P2 and N0 was measured for each exposure group and compared to that of the nonexposed (control) group. Both the (a) noise and (b) fuel exposed groups exhibited conduction times that were generally similar to that of the control group. However, the fuel+noise group exhibited major delays in conduction time (c).

