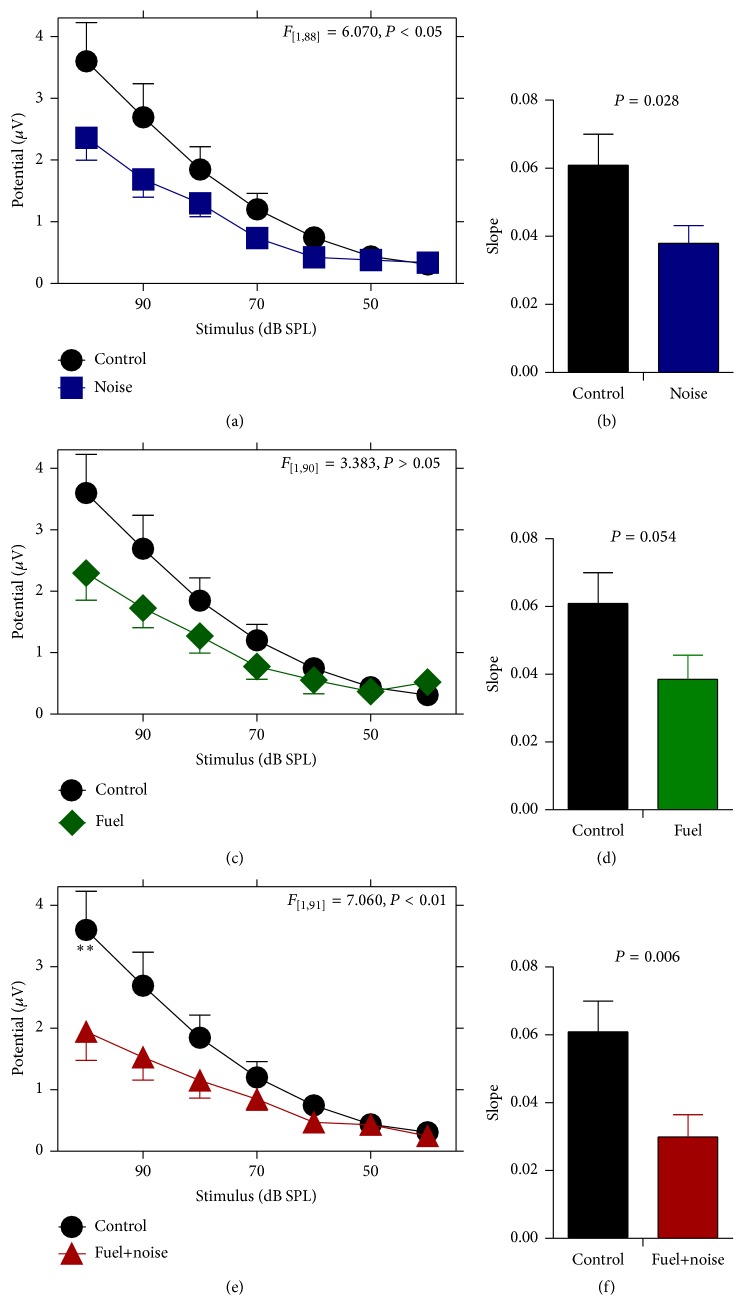
Figure 4.
Abnormal response magnitude. The potential difference between P2 and N0 was measured for each exposure group and compared to that of the nonexposed (control) group. (a) After noise exposure there was a reduction in stimulus response magnitude across a wide range of stimulus levels. (b) This was further confirmed with a truncated stimulus response growth rate (slope). (c and d) Similar, but less severe outcomes were observed after fuel-only exposure. (e and f) Combined exposure to fuel and noise resulted in a significant reduction in stimulus response magnitude which was further supported by a truncated slope.

