
Figure 1.
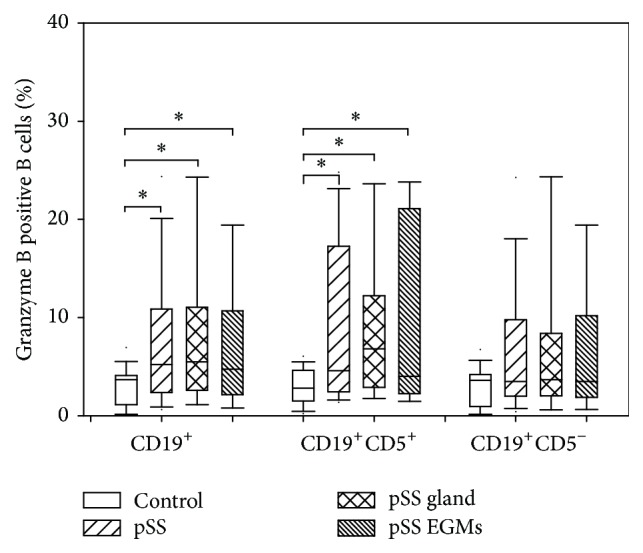
Granzyme B expression of B cell subsets. Box plots show median, upper, and lower quartiles; lines extending vertically from boxes indicate 5–95 percentile ranges. Statistically significant differences are indicated by ∗.
Official websites use .gov
A
.gov website belongs to an official
government organization in the United States.
Secure .gov websites use HTTPS
A lock (
) or https:// means you've safely
connected to the .gov website. Share sensitive
information only on official, secure websites.
Granzyme B expression of B cell subsets. Box plots show median, upper, and lower quartiles; lines extending vertically from boxes indicate 5–95 percentile ranges. Statistically significant differences are indicated by ∗.