Figure 2.

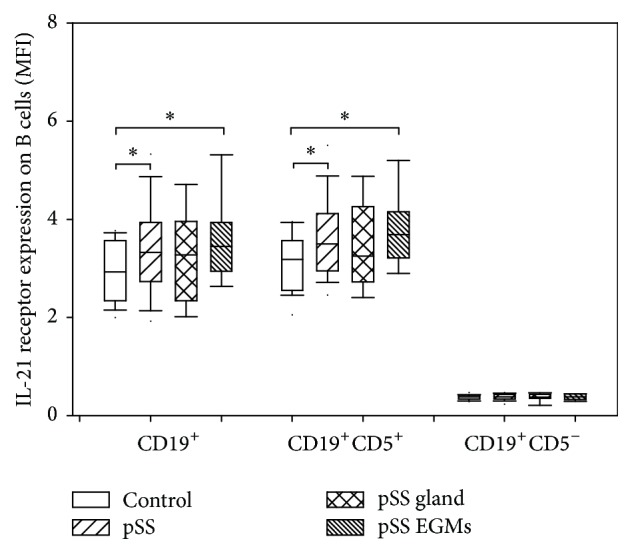
Interleukin-21 receptor expression of B cell subsets. Box plots show median, upper, and lower quartiles; lines extending vertically from boxes indicate 5–95 percentile ranges. Statistically significant differences are indicated by ∗.

Interleukin-21 receptor expression of B cell subsets. Box plots show median, upper, and lower quartiles; lines extending vertically from boxes indicate 5–95 percentile ranges. Statistically significant differences are indicated by ∗.