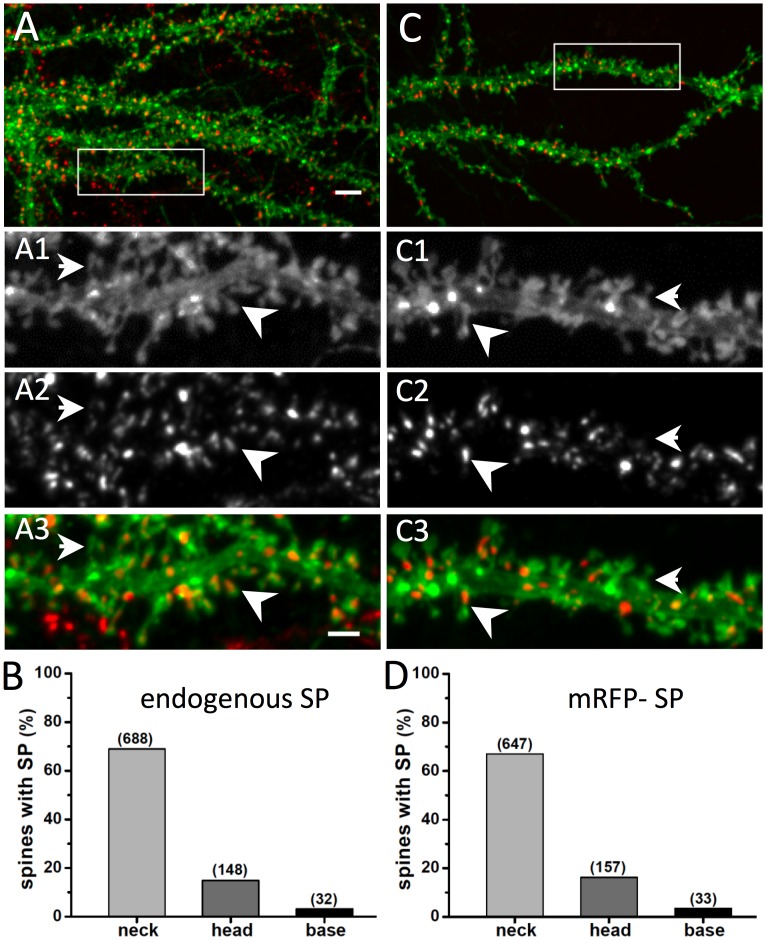
Fig 1. Distribution of SP in dendritic spines of hippocampal cultured neurons.
(A) Localisation of endogenous SP in dissociated cultured hippocampal neurons transfected with TMD-pHluorin (green) for the visualisation of the spine morphology and immunolabelled for SP (red). Higher magnifications of the selected area (white box) are shown in A1 (TMD-pHluorin), A2 (SP) and A3 (merged image). The arrowhead indicates a SP cluster located in a spine neck, whereas the arrow points to a spine devoid of SP. Scale bars: 5 μm in A, 2 μm in A1-3. (B) Data quantification shows that 87.0 ± 1.1% (mean ± SD) of spines overall are positive for SP. A more refined analysis indicates a preferential distribution in the spine neck compared to head or spine base compartments (neck, 68.9 ± 1.5%; head, 14.8 ± 1.1%; base, 3.2 ± 0.6%; n = 998 spines from 3 independent experiments; Table A in S1 File). (C) Recombinant mRFP-SP distribution in hippocampal neurons. Neurons were co-transfected with TMD-pHluorin (green) and mRFP-SP (red). Zoomed images of the selected area (white box) are shown in C1 (TMD-pHluorin), C2 (SP) and C3 (merged image). (D) Quantitative analysis indicates that 86.7% ± 1.1% of all spines contain mRFP-SP clusters. The distribution within the neck, head and base of the spine is similar to that observed for endogenous SP (neck, 67.0 ± 1.5%; head, 16.3 ± 1.2%; base, 3.4 ± 0.6%; n = 965 spines from 4 experiments; Table A in S1 File).

