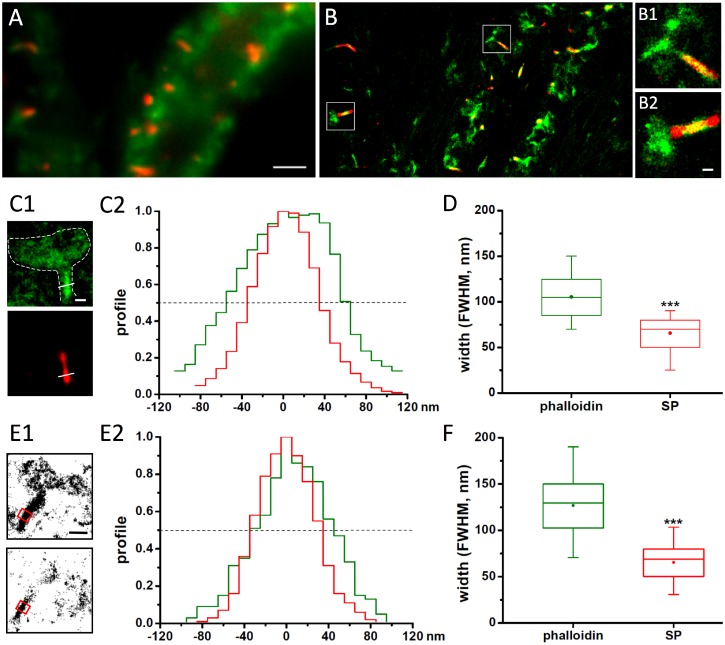
Fig 2. SP distribution within the spine neck.
(A) Conventional fluorescence microscopy of a lentivirus-infected hippocampal neuron expressing dendra-SP (red). F-actin filaments were labelled with A647-phalloidin (green). (B) Super-resolution STORM/PALM imaging of the same dendritic segment. Single dendra and A647 fluorophore detections were rendered with a 2D Gaussian distribution with σ = 10 nm and represented in false colours (red and green, respectively). B1 and B2 are high magnifications of individual spines (white boxes in B), where SP is clearly visible along the spine neck, while phalloidin stains both neck and spine head. (C) Analysis of the full width at half maximum (FWHM) of the SP (red) and phalloidin domains (green) along a line through the spine neck in rendered STORM/PALM images. Measurements from an individual spine are shown in C1 and C2, the shape of the spine head is indicated in the upper panel in C1 (white outline based on the phalloidin staining). Note that the profile peaks in C2 were manually aligned. (D) Quantification of the FWHM of phalloidin and SP domains in spine necks. The box indicates the median, 5, 25, 75 and 95% of the spine population, the mean width is shown as a dot (n = 33 spines, 5 cultures, see also Table C in S1 File). (E,F) Analysis of SP and F-actin profiles in a 200 nm wide segment across the spine neck (red square in E1), based on the single molecule detections in pointillist images. An individual spine is shown in E1 (phalloidin: top, SP: bottom) with the corresponding detection profiles in E2. The population measurements are given in panel F. Scale bars: 2 μm in A, 200 nm in B2 and C1, 500 nm in E1.

